
Progress & data
From every trial to a clear picture of progress
VITL saves each trial as it happens. The same record feeds the dashboard, session history and the Progress Report: nothing to re-enter, nothing to export first.
Dashboard
Where every day starts
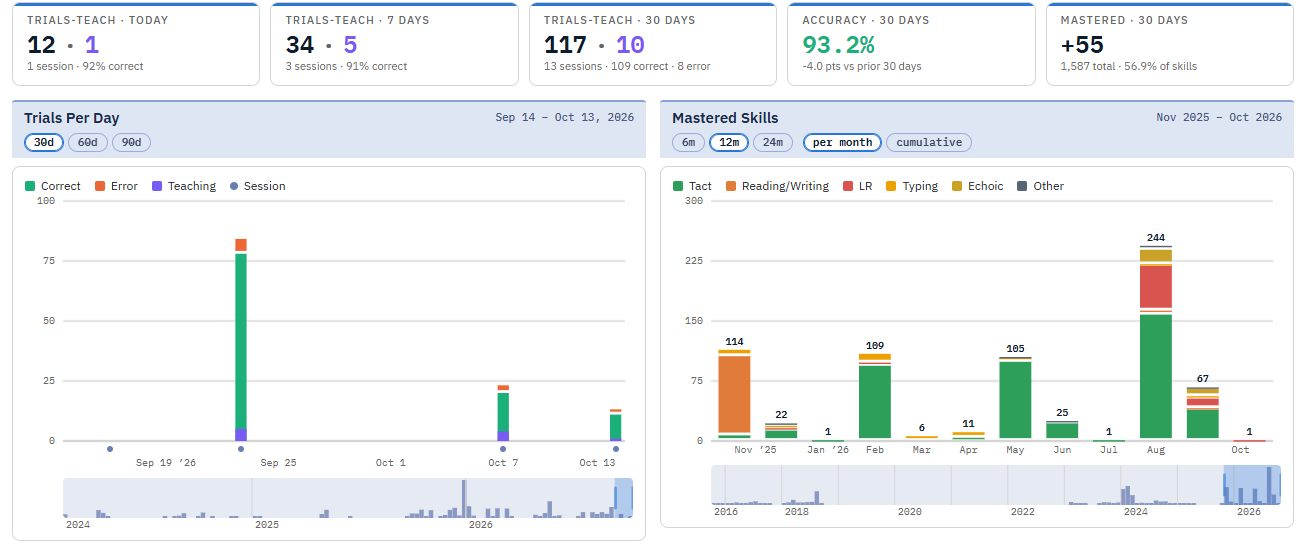
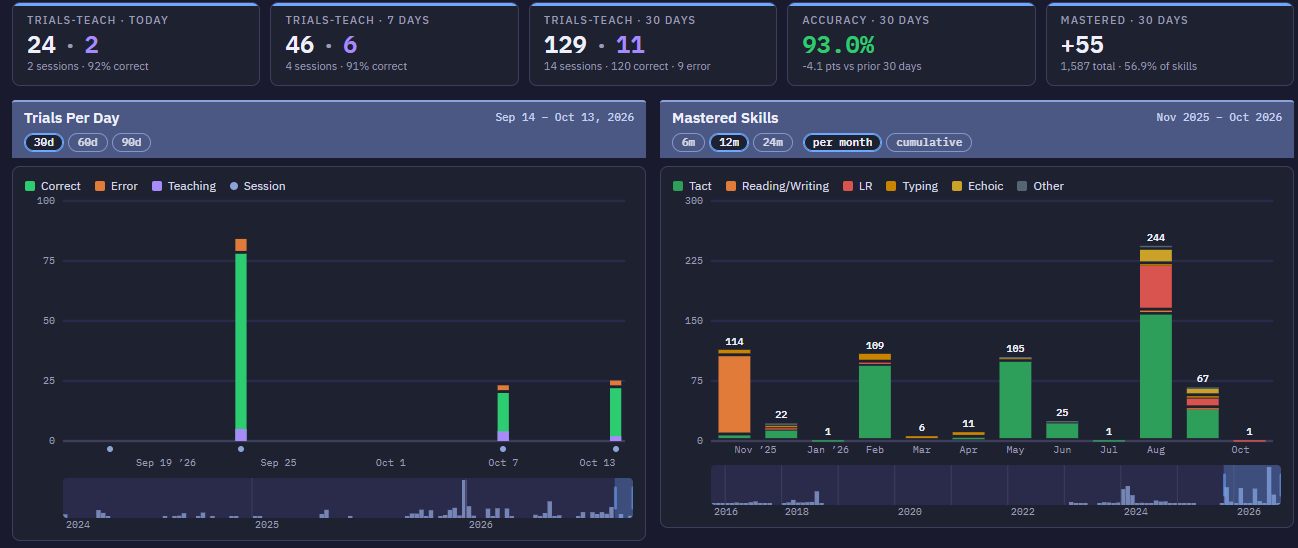
Load a learner and see how the week is going before the first trial.
- Trials today, this week and this month
- Accuracy compared with the month before
- Trials per day, with a scroller back through the learner's history
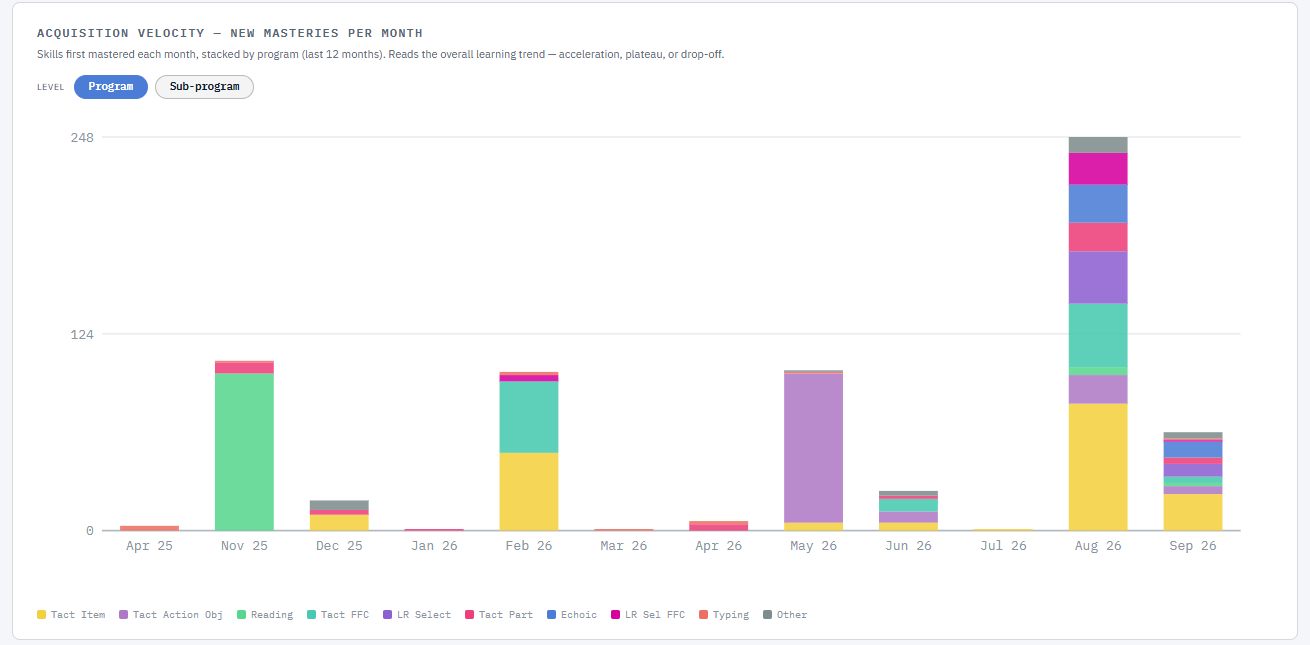
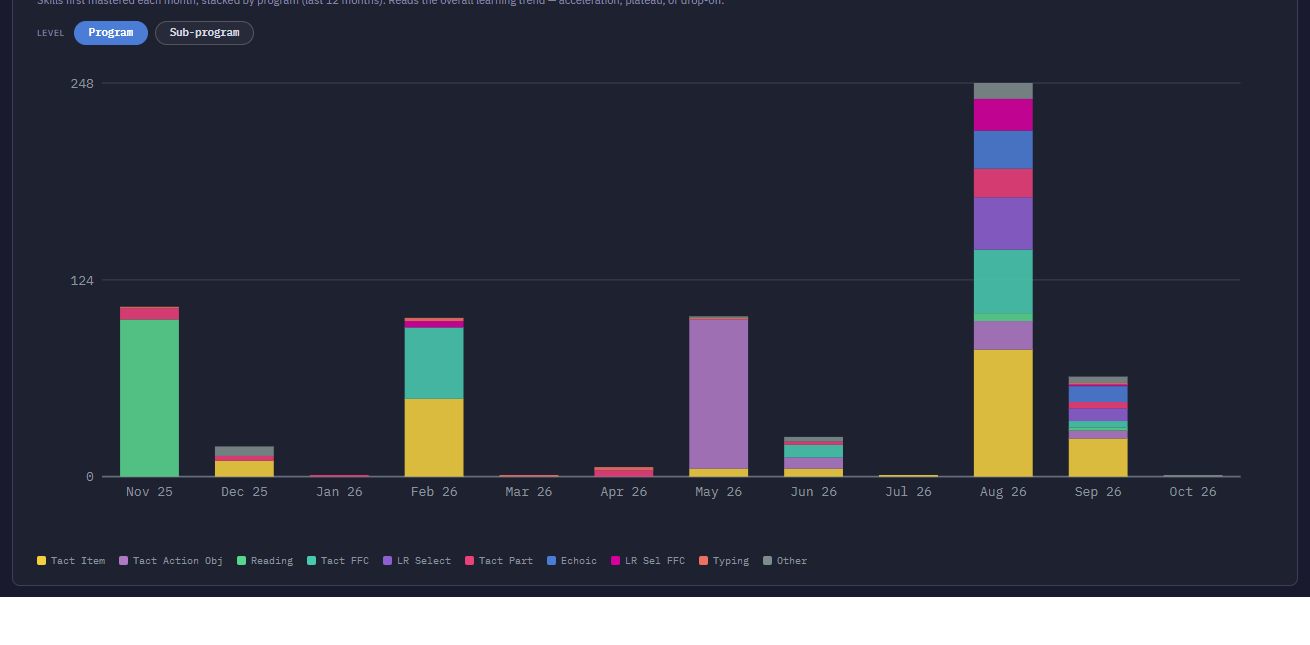
- New masteries per month by program family
- Trials per instructor and recent sessions
Progress Report
The whole picture, always current
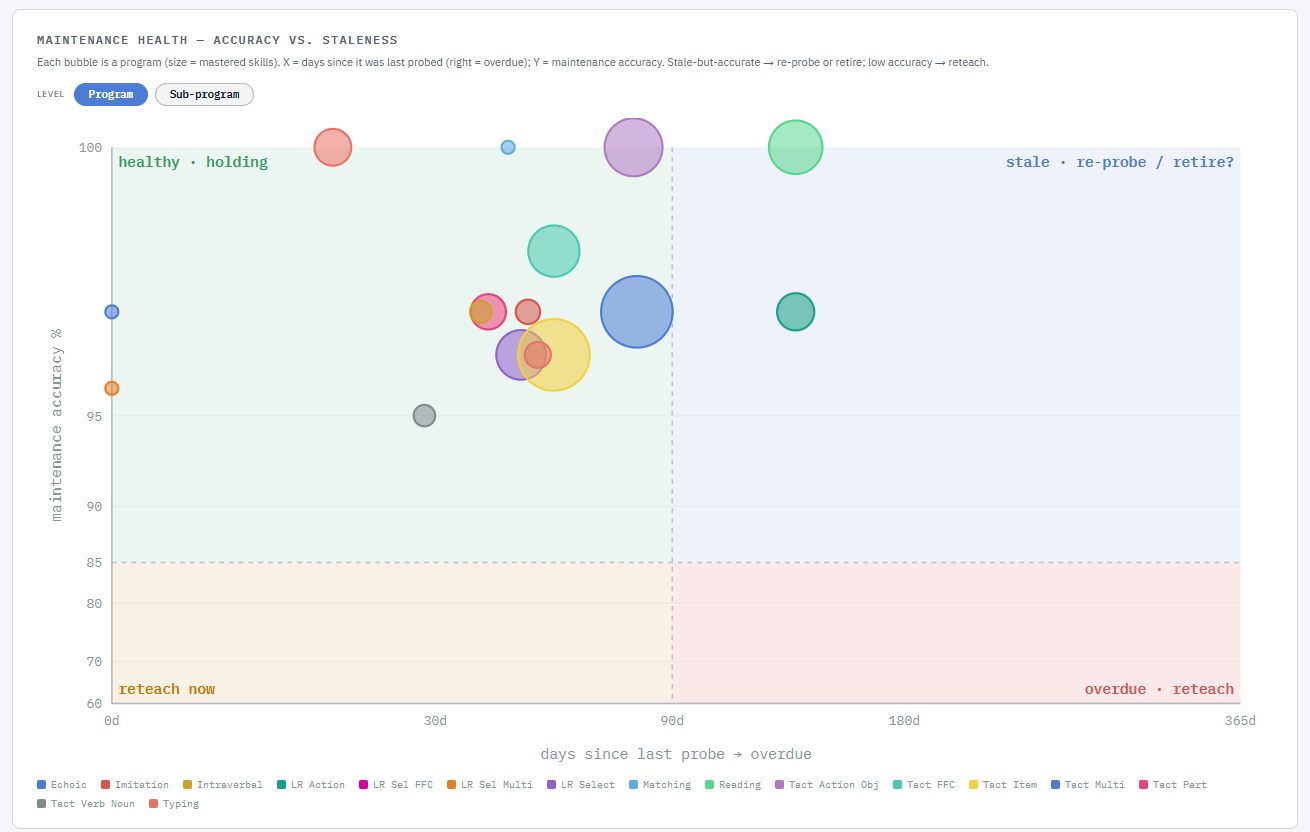
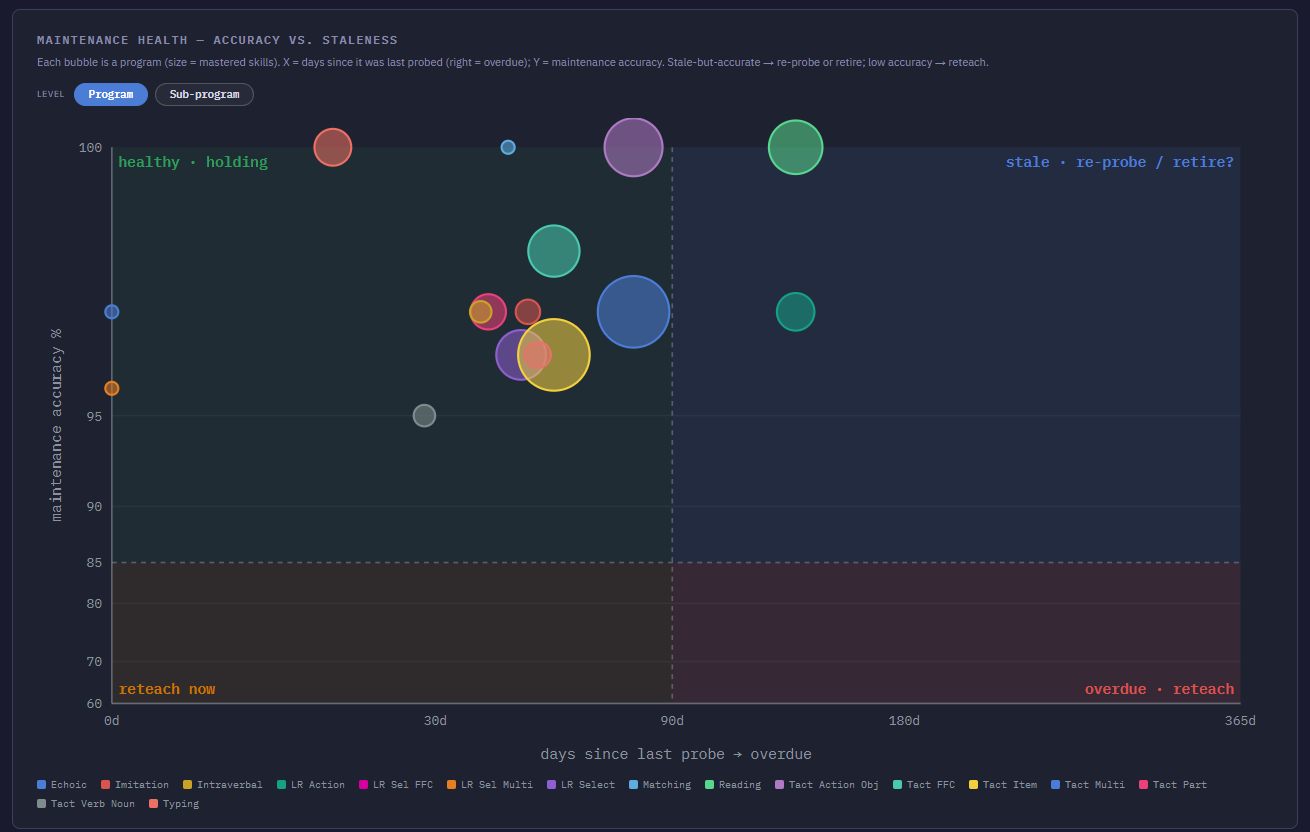
The Progress Report is built from the learner's data each time it opens, so it is never out of date.
- An executive summary and the VITL score
- Charts for maintenance health, accuracy over time and pace of acquisition
- Program Flow: every program on the VB-ISA levels, with its status
- Which programs are ready to introduce next
- Download the report to share with the team
Trial-level detail
Every number traces back to a trial
Probe Summary
Weekly and daily probe sheets, one row per skill: the evidence behind every status change.
Session history
Every session and every trial, with the skill, the picture used, the result and the instructor.
Skill history
Each skill's path from queued, to target, to mastered, and back to review when needed.
See it with your own data
Ask us for a walkthrough of the dashboard and the Progress Report.